Visualizing Julia Sets
This week, I again played with fractals. In one of the previous posts, I explored the Mandelbrot and the Burning Ship. Continuing this theme, I experimented with Julia sets (for the quadratic map) — this time with domain coloring.
Now the quadratic Julia set is defined very similar to the Mandelbrot — z^2+c. The only difference is that the Mandelbrot is defined in the parametric space (c), while the Julia set is defined on the complex plane itself (z). This distinction actually makes it a lot more intuitive to visualize Julia sets, compared to the Mandelbrot set.
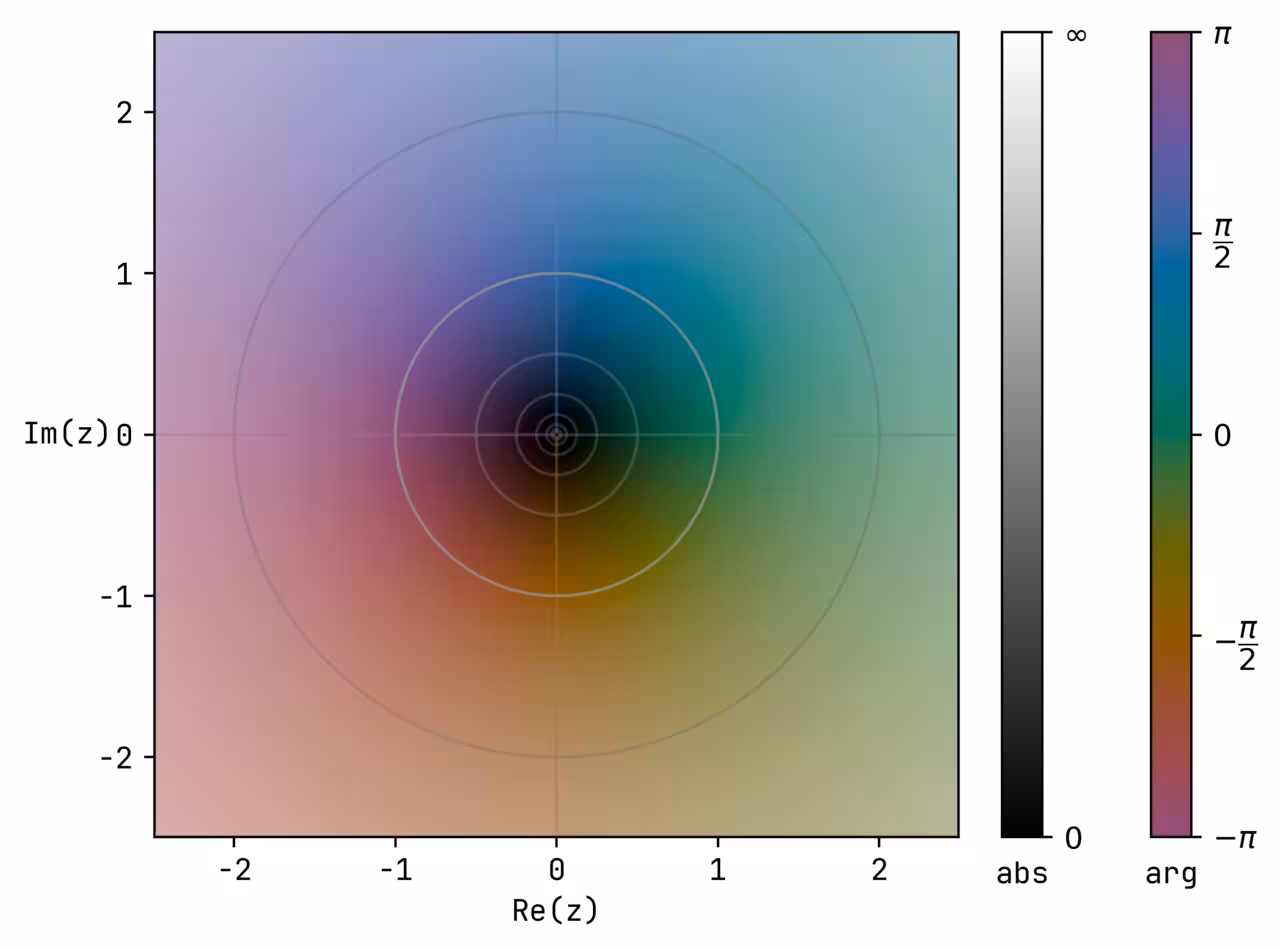
To visualize complex function transformations, I’ll just use domain coloring. Most domain coloring diagrams use the HSL colorspace, but I find it introduces visual distortions, so I am using a more perceptually uniform colorspace. The hue describes the phase and the luminance represents the magnitude of the numbers in the complex plane.
Addition and subtraction ‘shift’ the space, while squaring transforms the complex surface such that entire space is duplicated and ‘squished’ to fit in the original space.
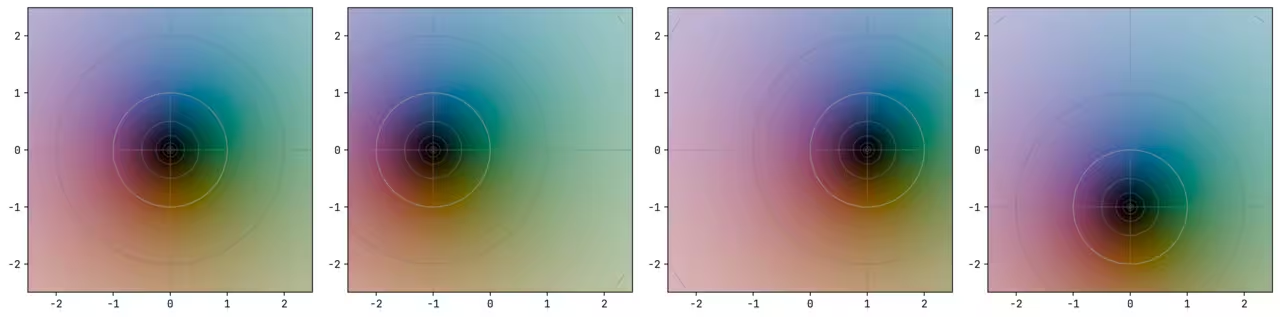
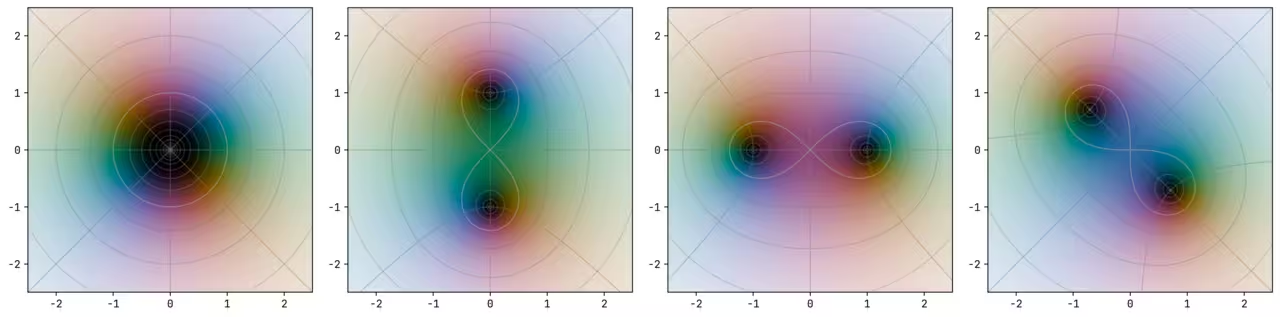
The first plot of the top row represents z, the second is z+1, and the third and fourth are z-1 and z+i. The ones below show z^2, z^2 + 1, z^2 - 1, and z^2 + i.
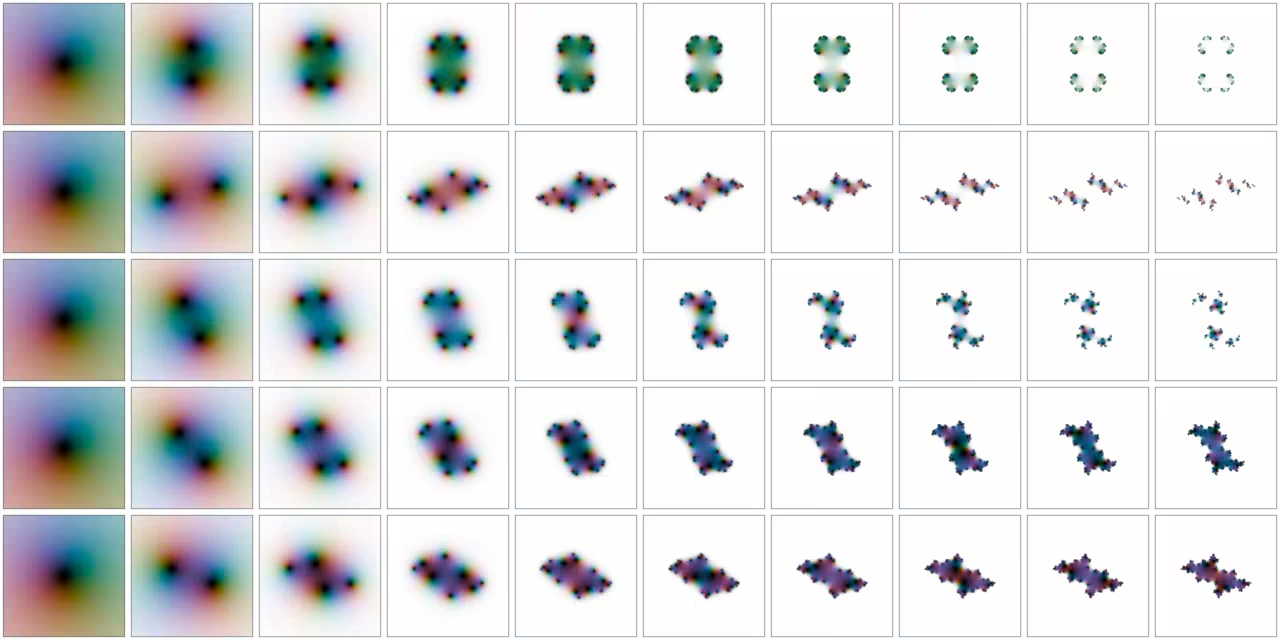
The ‘duplication and squishing’ of the space reveals why applying these operations for infinite iterations will form fractal structures. In fact, points where the magnitude does not diverge to infinity (non-white regions) is exactly the Julia set. The following visualizations stop after nine iterations.
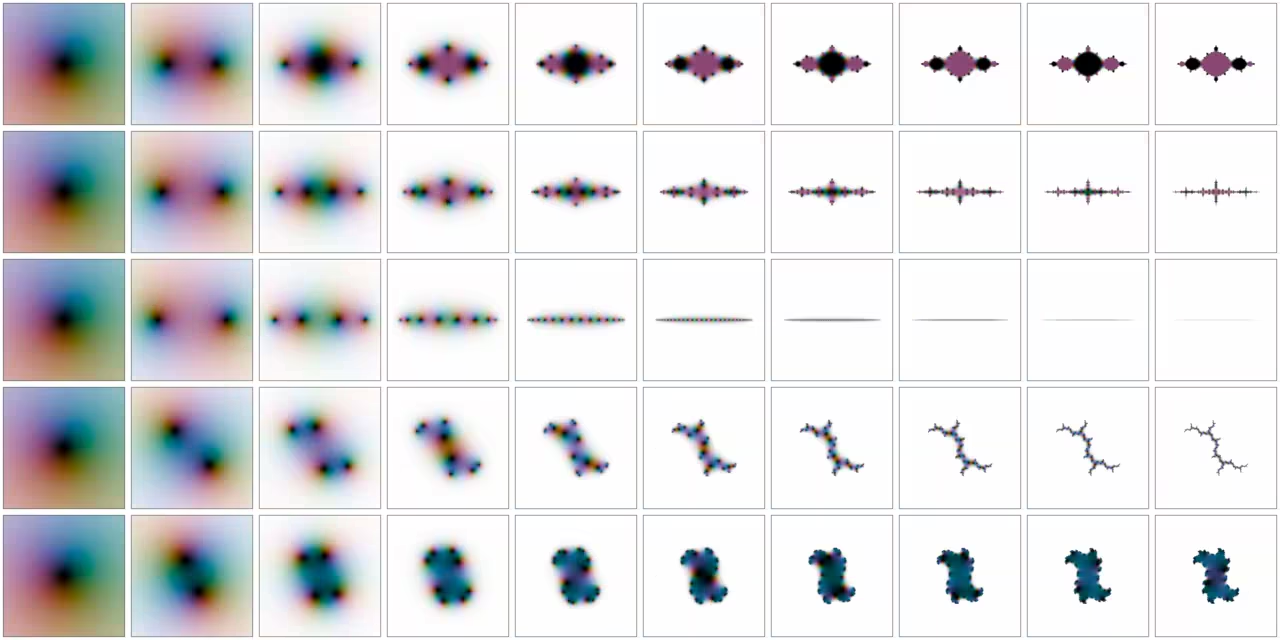
If c is not part of the Mandelbrot set, it implies that the initial z at 0 will diverge to infinity. And since these transformations never connect sets, the set will always be disconnected and applying the operations for infinite iterations will results in infinitely small, infinite points — called Fatou dust. The last two might look connected but it is because only nine iterations of the transformations are performed.
There are other ways to study complex dynamics, but I think this is one the easier ways to comprehend it (at least for Julia sets). I think there’s a lot yet to uncover that gives a fuller picture using phase plots and bifurcation diagrams — but that’s too long, and more apt as a full length article for lab. One day I might write about it. Maybe.
Other than fractals, week was slightly hectic. Aced my lab exams, again organized my data, and studied public choice theory after a brief read of Why Nations Fail. I went to Udupi for the weekend as well, and had a tiny accident there — hence the delayed post. Things are also slowly getting back on track with The Plan™. For this week, I want to finish the basics of computer networks and protocols, and start with operating systems next week. Perhaps some more economics too. We’ll see.
Cya next week.